
Time for change survey
results 2022
Research evaluation
How important is demonstrating the impact of research on society to academics, and how open are they to change in comparison to their institutions?
These are just some of the questions asked in our Time for Change survey. Now in its fourth year, the survey explores the challenges within academic culture and gauges interest for change from across the globe.
Take a look at the main findings from the survey relating to research evaluation and the key factors that are holding back or driving societal change.
On this page
Top findings
This global survey was conducted during July–August 2022, and in total received 1,427 responses from academics worldwide.

Beating hearts – societal change
Over 80% of academics say demonstrating the impact of research on society is important to them both personally and to their institutions, which is significantly up from four years ago. It seems to be less important to the older generation/those with 20+ experience post PhD.

Impact factors still strong
Two thirds still rely on citations and IFs remain the dominant metric for research quality. Compared to five years ago reliance placed on traditional metrics has risen significantly, suggesting a backward step during the pandemic.

Career & reputation drivers
The importance placed on career advancement and improved reputation (73%) by demonstrating the impact of their work has risen in the last year.

Hungry for change
A strong appetite for change remains, over a third are very open and taking action, another third very open but not yet taken action. Latin America and UK lead in putting plans into action, Australasia seem to struggle and be behind the rest of the world.

Rhetoric & action misaligned
Little progress in institutions in driving change compared to four years ago, and still only 17% of institutions have taken any action.

A broader perspective
Main changes wanted are greater value placed on the impact on society (37%), particularly marked by Asian, Indian and Sub-Sahara African researchers, 27% want broader metrics and 14% want a change in the way incentives are used to publish research work.
Barriers to change
Forty seven per cent say the main challenges are difficulty in tracking research beyond academia and incentives for career progression still aligned to traditional metrics. The issue of a lack of funding for open research rose significantly as a perceived barrier with 26% saying last year they saw it as a problem compared to 42% this year.

Growing appetite for open
The biggest shift in the last four years has been the appetite for open access and sharing of open data sets (46% considering this compared to 29% four years ago).

Support for new formats
Thirty seven per cent are considering publishing non-traditional content such as short-form, policy briefs, blogs, etc.

Impact at the start
A strong desire (45%) for better tracking of potential societal impact at the start of a research project (not retrospectively trying to measure).

Growing demand for policy briefs
Seventy four per cent want them to be more accessible, 70% say they are an important route to get academic research outside of academia, 69% want their research to be translated into a policy brief and 56% feel confident in writing a policy brief.

Questions


Q1. On a scale of 1–10 where 1 is not at all important and 10 is very important, how important is demonstrating impact of research on society to...? (Average score out of 10.)
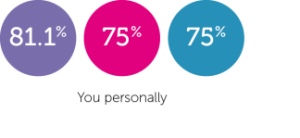


| Area, scored 8–10 | You personally | Your university | Funders | Society | Policymakers |
|---|---|---|---|---|---|
| Overall 2022 | 81.1% | 71.2% | 67.8% | 65.4% | 65.0% |
| Overall 2021 | 75% | 69% | 64% | 61% | 61% |
| Overall 2020 | 75% | 65% | 67% | 59% | 61% |
Q2. How is the quality of your research impact currently measured? (Please select up to three options.)


|
Area, percentage of times chosen in top three |
Journal citations and impact factors |
A measurable change in practice, policy or behaviour |
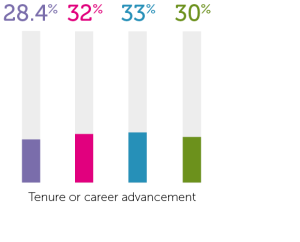
Tenure or career advancement |
Provable effects of research in the real world |
|---|---|---|---|---|
|
Overall 2022 |
66.2% |
28.5% |
28.4% |
27.7% |
|
Overall 2021 |
70% |
25% |
32% |
26% |
|
Overall 2020 |
71% |
24% |
33% |
23% |
|
Overall 2019 |
58% |
59% |
30% |
58% |
|
Area, percentage of times chosen in top three |
Funding opportunities |
Improved societal, health, economic or environmental outcomes |
Mobilised knowledge that affects decision-making in applied settings |
Other (including bottom 3 chosen options) |
|---|---|---|---|---|
|
Overall 2022 |
25.8% |
24.3% |
20.0% |
37.1% |
|
Overall 2021 |
26% |
21% |
18% |
33% |
|
Overall 2020 |
31% |
19% |
18% |
35% |
|
Overall 2019 |
35% |
61% |
49% |
N/A |
Q3. On a scale of 1 to 5, where 1 is not at all important and 5 is very important, how important are the following factors in helping achieve broader impact with your work?


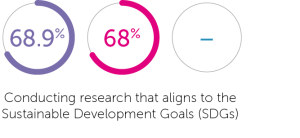

| Area, percentage important or very important | Making a difference to society | Improving my reputation | Advancing my career | Having more funding opportunities | Conducting research that aligns to the Sustainable Development Goals (SDGs) | Meeting institutional or funder requirements |
|---|---|---|---|---|---|---|
| Overall 2022 | 79.5% | 72.9% | 72.7% | 69.2% | 68.9% | 64.0% |
| Overall 2021 | 85% | 70% | 69% | 62% | 68% | 60% |
| Overall 2020 | 82% | 71% | 67% | 61% | - | 60% |
| Sub-Saharan Africa | 92.0% (94%) | 82.7% (86%) | 88.7% (89%) | 74.7% (73%) | 88.7% (85%) | 74.0% (70%) |
Q4. How strongly do you support the idea of changing the way research impact is measured? (Please select 1 answer.)


| Area % chosen | Very open and I have already driven change in the way I approach research | Very open but I have not yet driven change in the way I approach research | Fairly open to change | Neither open to change nor against it | Fairly against change | Not at all open |
|---|---|---|---|---|---|---|
| Overall 2022 | 34.8% | 32.9% | 26.7% | 4.5% | 0.7% | 0.4% |
| Overall 2021 | 34% | 33% | 25% | 6% | 1% | 1% |
| Overall 2020 | 33% | 36% | 22% | 7% | 2% | 1% |
| Overall 2019 | 38% | 31% | 24% | 5% | 1% | 1% |
Q5. How supportive / interested are those in your broader institution in driving change when it comes to other ways to measure research impact? (Please select one answer.)


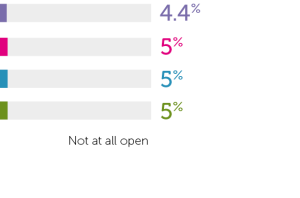
| Area % chosen | Fairly open to change | Very open but have not yet driven change in the way I approach research | Neither open to change nor against it | Very open and they have already helped drive change in the way I approach research | Fairly against change | Not at all open |
|---|---|---|---|---|---|---|
| Overall 2022 | 33.0% | 20.5% | 19.0% | 16.7% | 6.4% | 4.4% |
| Overall 2021 | 30% | 20% | 22% | 13% | 9% | 5% |
| Overall 2020 | 29% | 19% | 23% | 13% | 11% | 5% |
| Overall 2019 | 31% | 19% | 20% | 16% | 10% | 5% |
Q6. What main change would you like to see in the way research quality is measured? (Please select one option.)


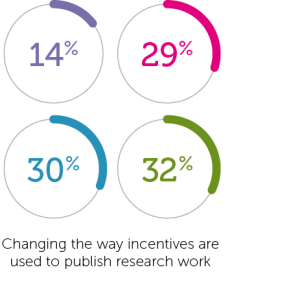


| Area % chosen | New option: Valuing impact on society / social changes | Introducing other metrics beyond citation metrics | Changing the way incentives are used to publish research work | Dropping citation metrics such as the Impact Factor or CiteScore altogether | New option: Attaching DOIs (digital object identifiers) to all research outputs | New option: There is no change needed | Other |
|---|---|---|---|---|---|---|---|
| Overall 2022 | 36.7% | 26.6% | 14.0% | 13.0% | 4.7% | 3.1% | 2.1% |
| Overall 2021 | - | 47% | 29% | 18% | - | - | 6% |
| Overall 2020 | - | 46% | 30% | 17% | - | - | 6% |
| Overall 2019 | - | 51% | 32% | 10% | - | - | 7% |
Q7. Which of the following do you consider to be the biggest 'challenges' of changing the way research impact is assessed? (Please select all that apply.)


| Area, % of times chosen | Difficulty in tracking research impact beyond academia | Incentives for career progression still aligned to traditional impact metrics (i.e., publishing in ranked journals) | Lack of clarity on what measures would replace rankings to assess quality | Lack of funding for open research | Organisation resistant to change / entrenched culture |
|---|---|---|---|---|---|
| Overall 2022 | 47.4% | 47.1% | 42.7% | 41.9% | 40.5% |
| Overall 2021 | 51% | 55% | 49% | 41% | 43% |
| Overall 2020 | 55% | 56% | 49% | 39% | 47% |
| Overall 2019 | 41% | 60% | 44% | 26% | 34% |
| Area, % of times chosen | Difficulties around non-academic collaboration | Regional drivers (discrepancies around impact ‘readiness’) | Lack of case studies or tools to help | Other, please specify | None of the above |
|---|---|---|---|---|---|
| Overall 2022 | 30.4% | 13.0% | 11.9% | 3.5% | 0.5% |
| Overall 2021 | 28% | 13% | 14% | - | - |
| Overall 2020 | 30% | 14% | 13% | - | - |
| Overall 2019 | - | 9% | - | - | - |
Q8. When it comes to your research, what types of change would you consider implementing? (Please select all that apply.)


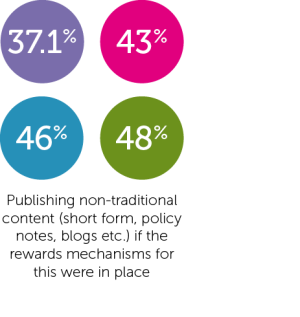


| Area, % of times chosen | Publishing Open Access and sharing links to supporting datasets to get more ‘eyeballs’ on my work | Better tracking of potential societal impact at the start of a research project (not retrospectively trying to measure) | Publishing non-traditional content (short form, policy notes, blogs etc.) if the rewards mechanisms for this were in place | Saving published work to my institutional repository (green Open Access) |
|---|---|---|---|---|
| Overall 2022 | 45.8% | 44.8% | 37.1% | 30.9% |
| Overall 2021 | 46% | 40% | 43% | 34% |
| Overall 2020 | 51% | 44% | 46% | 34% |
| Overall 2019 | 29% | 51% | 48% | 24% |
| Area, % of times chosen | Publishing my research with a publisher that auto-deposits my Author's Accepted Manuscript (AAM) on my behalf | I would like to make these changes, but feel unable to do so due to my institution | Other | I’m not considering changing my processes / methodologies |
|---|---|---|---|---|
| Overall 2022 | 24.9% | 18.3% | 2.7% | 8.4% |
| Overall 2021 | 28% | 22% | 4% | 13% |
| Overall 2020 | 28% | 22% | 5% | 10% |
| Overall 2019 | - | - | 4% | 9% |
Q9. In your opinion what are the best way(s) to enable change to happen? (Please select up to three options.)
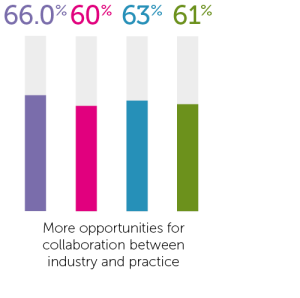

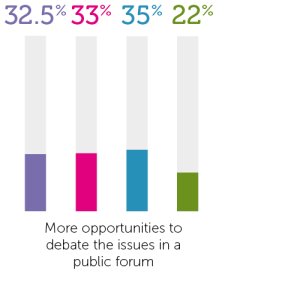


| % Of times chosen in top 3 | More opportunities for collaboration between industry and practice | More publishers making research Open Access | More opportunities to debate the issues in a public forum | Greater understanding around impact literacy training |
|---|---|---|---|---|
| Overall 2022 | 66.0% | 48.5% | 32.5% | 31.8% |
| Overall 2021 | 60% | 50% | 33% | 31% |
| Overall 2020 | 63% | 52% | 35% | 31% |
| Overall 2019 | 61% | 35% | 22% | 35% |
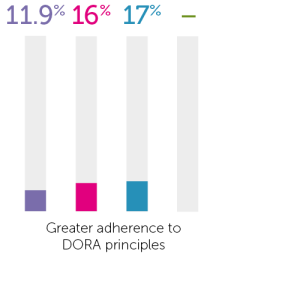
| % Of times chosen in top 3 | More publishers making research Open Access | More opportunities to debate the issues in a public forum | Greater understanding around impact literacy training | Communications support | Greater adherence to DORA principles | Other |
|---|---|---|---|---|---|---|
| Overall 2022 | 48.5% | 32.5% | 31.8% | 25.4% | 11.9% | 4.4% |
| Overall 2021 | 50% | 33% | 31% | 24% | 16% | 7% |
| Overall 2020 | 52% | 35% | 31% | 24% | 17% | 8% |
| Overall 2019 | 35% | 22% | 35% | 23% | N/A | 7% |
2021 academic culture survey
Our third academic culture survey gathered views on change between July–August 2021. You can read the full Time for change 2021 report, here.
Are you in?
For championing alternatives to traditional academic metrics and rewards? Let’s work together to help the sector break ties with old measures of impact and enjoy a fairer, more equitable environment for research to thrive.
Share this content


